Meta description: Bitcoin (BTC/USD) and Ether (ETH/USD) finally showed a bullish breakout above the local resistance zone after building a lengthy bearish correction.
BTC/USD
Daily
Both Bitcoin (BTC/USD) and Ether (ETH/USD) finally showed a long awaited bullish breakout above the local resistance zone after building a lengthy bearish correction and consolidation zone.
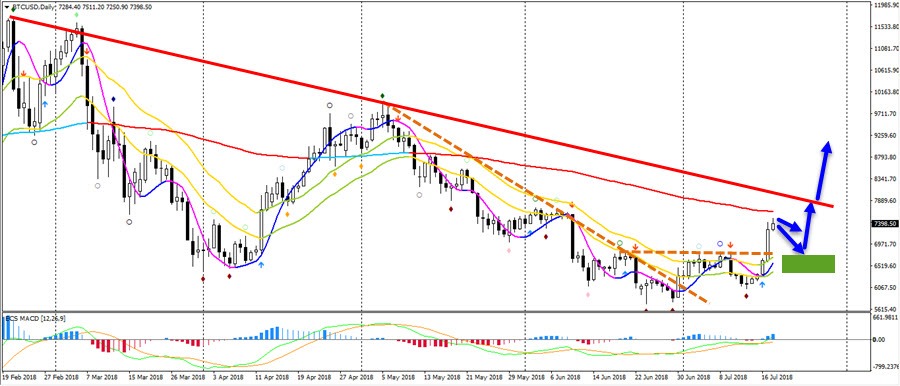
BTC/USD broke above the horizontal resistance trend line (dotted orange) and for the 2 nd time above the 21 ema resistance zone, which could indicate the potential start of a new uptrend. Price still has a key long-term moving average and resistance trend line (red) above it which could be the next major bounce or break spot. A bullish bounce and breakout however seem to be more likely at this point (blue arrows).
ETH/USD
Daily
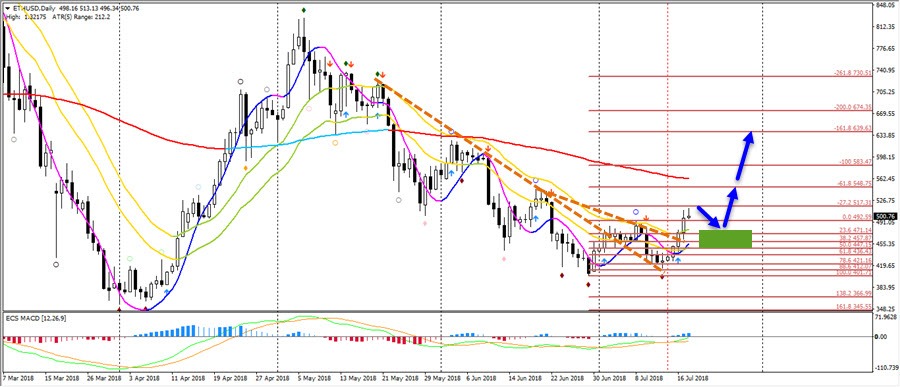
ETH/USD also broke above the resistance levels (dotted orange) although the daily candle breakout was smaller than BTC/USD which could indicate that Bitcoin is looking at a bigger breakout than Ether. That said, here too the path of least resistance could be up if price bounces at support (green) and breaks above the long-term moving average.


0 Comments